

HR metrics: which ones matter and how to calculate them | absentify
HR metrics are measurable indicators that form the basis for far-reaching decisions made by the people function. They show how healthy, stable and productive the workforce is. With the EU Pay Transparency Directive and digital record-keeping obligations, certain metrics will become mandatory to report from 2026.
HR Metrics: The Essentials at a Glance
- HR metrics are indicators with which the people function objectively steers attrition, absenteeism, time-to-hire and pay structures.
- The most important HR metrics fall into three categories: absence and health (sickness rate, absenteeism rate), turnover and stability (attrition rate, average tenure) and recruiting (cost per hire, time to hire).
- The EU Pay Transparency Directive obliges companies with 100+ employees to report on pay structures and pay gaps. In addition, broader digital documentation duties apply for working time and absences.
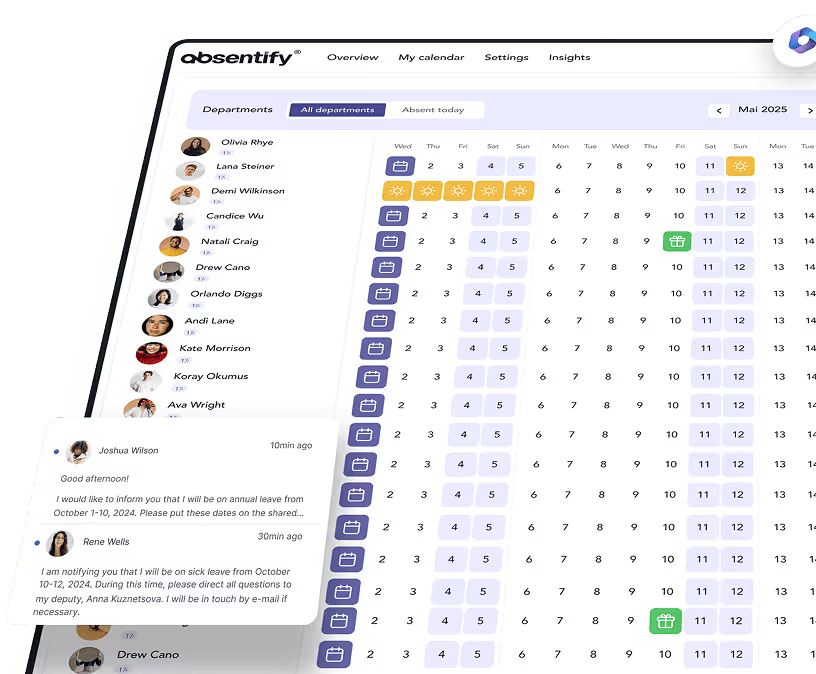
- absentify automates the capture of absence and leave data directly inside Microsoft 365 and provides the data foundation for HR metrics such as the sickness rate or absenteeism rate, ready to be visualised in Power BI as an HR dashboard.
Which HR Metrics Are Used in Companies?
The most important HR metrics fall into three categories: absence and health, turnover and stability, and recruiting efficiency. Each of these categories needs its own formulas and benchmarks.
| Metric | Formula | Benchmark EU/UK 2025/26 | Legally relevant 2026 |
|---|---|---|---|
| Sickness absence rate | (Sick days / planned working days) × 100 | ø 2.6 % UK (CIPD Health and Wellbeing at Work) | Yes (record-keeping duty) |
| Attrition rate | (Leavers / average headcount) × 100 | 10 to 25 %, depending on sector | Indirect |
| Cost per hire | Recruiting costs / number of hires | £3,000 to £8,000 | No |
| Time to hire | Days from job posting to signed contract | ø 35 to 44 days | No |
| Gender pay gap | (ø gross men − women) / ø men × 100 | 12.7 % EU unadjusted | Yes (EU directive) |
Absence and Health: Sickness Rate and Absenteeism Rate
The sickness rate is the central HR metric for occupational health management and sits at around 2.6 percent in the UK. How to calculate the sickness rate is its own discipline, because many companies set planned working days incorrectly, particularly for part-time staff.
The absenteeism rate bundles all working days not worked, i.e. illness, unauthorised absence and other absences.
Turnover and Stability: Attrition Rate and Retention
The attrition rate measures how many employees leave the company within a year. Values above 20 percent are considered a warning signal in most sectors.
Average tenure rounds out the picture and shows whether attrition mainly affects new joiners or established staff.
Recruiting Efficiency: Cost per Hire and Time to Hire
The cost per hire aggregates all recruiting costs per hire. The benchmark range across the UK and EU lies between £3,000 and £8,000. Time to hire measures the days between posting a vacancy and the signed contract. Values below 35 days are considered very competitive.
What Distinguishes Operational from Strategic HR Metrics?
Operational HR metrics steer day-to-day operations. They measure short-term effects such as sickness rate, overtime volume or open vacancies.
Strategic HR metrics steer long-term developments. They track attrition rate, average tenure, cost per hire or gender distribution in leadership positions. Workforce capacity planning is also built on a metrics foundation.

What Changes Legally for HR Metrics in 2026?
The EU Pay Transparency Directive, the obligation to record working time digitally and additional digital record-keeping duties shift the mandatory scope of HR metrics:
- EU Pay Transparency Directive: Companies with 100+ employees report on pay structures, gender pay gaps and career data. The transposition deadline across EU member states was 7 June 2026.
- Digital working-time tracking: Following the CJEU ruling C-55/18 (CCOO) and equivalent national rulings, systematic recording is mandatory; national legislation specifies the digital format.
- Extended record-keeping duties: Absences, leave entitlements and remaining leave must be documented in an audit-proof way.
How Do I Calculate and Visualise HR Metrics in Microsoft 365?
Microsoft 365 offers two paths to calculate HR metrics. Excel works for small teams, Power BI for HR dashboards that scale better. The choice depends on team size, data volume and refresh cadence.
When Is Excel Enough to Calculate HR Metrics?
For teams under 30 employees, an Excel sheet can be enough to calculate the most common HR metrics. There you can capture sickness rates, leave balances and headcount for your team.
The first sheet collects employee master data (name, start date, contract hours), the second is the absence list (date, type, duration), the third is an analysis sheet with pivot tables.
The pivot table aggregates sick days and leave per employee and per month, and the sickness rate is calculated automatically with the formula:
As the team grows, however, maintaining this Excel sheet takes more and more of your time. The effort then grows in proportion to headcount, because every entry has to be made manually.

Calculate the sickness rate without Excel maintenance
absentify captures sick notifications directly in Microsoft Teams and gives you the sickness rate up to date — no manual pivot tables required.
How Does Microsoft 365 Deliver HR Metrics to Me?
Structured HR data are records in a uniform format, i.e. fixed columns for employee ID, absence type, start and end date and status flags. Only this format allows automatic calculations in Power BI. Unstructured HR data, by contrast, are email threads, PDF sick notes or handwritten notes from which metrics can only be derived through laborious pre-processing.
Power BI accesses the structured data directly through a connector and visualises HR metrics as a live dashboard by department, period or absence type. The prerequisite is a single data source for absences, sickness data and leave balances.
absentify provides this data source directly out of Microsoft Teams and Outlook. Every leave request, sick notification and home-office entry lands as a structured record in the system.
How to Build HR Metrics in Microsoft 365 with absentify
HR metrics are the data foundation for compliant HR reporting, board decisions and an objective view of your own workforce. With absentify you gain access to all the data needed to calculate sickness rate, attrition rate and recruiting metrics — directly in Microsoft 365:
- All time and absence data sit in one place, from leave and sickness through to home office and training.
- Sickness rate, share of long-term illness as well as gross and net capacity per department are calculated by the system automatically.
- You receive live analyses with filtering by department and time period directly inside Microsoft Teams Insights or Power BI.
- Power Automate triggers early warnings as soon as absences in a team exceed defined thresholds.
- Role-based access controls and EU hosting on Microsoft Azure for GDPR-compliant processing of sensitive HR data.
Would you like to simplify your HR metrics?
- No credit card required
- Unlimited free access
- Upgrade or cancel anytime
HR Metrics – Frequently Asked Questions
About the author

Anna Keller
Content manager at absentify
As a blog author at absentify, Anna Keller explains how companies can efficiently manage absences, vacations, and working hours. In her articles, she combines HR practice with Microsoft 365 tips for Outlook and Teams and provides templates, step-by-step instructions, and software comparisons for modern, digital processes.
Share article
More interesting articles
Reducing overtime: rights, duties and the process for employers and teams
Reducing overtime means offsetting accumulated extra hours with time off or payment. Under German employment law, the six calendar months or 24 weeks specified in the German Working Time Act apply solely to offsetting an extended working day against the statutory eight-hour average. Employment contracts, works agreements or collective agreements determine how an overtime balance can be reduced. Where these rules permit time off in lieu, the employer determines its timing and process within the scope of their right to give instructions.
Anna Keller
Content manager at absentify
When does unused leave expire? Deadlines and exceptions that determine your entitlement
Under German law, unused leave expires only under certain conditions: entitlement generally lapses on 31 December, or after the carryover period on 31 March, only if your employer has given you timely and specific notice of the impending expiry and you still do not take the leave. An exception applies in cases of continuous illness.
Anna Keller
Content manager at absentify
Employee Self Service (ESS): Definition, Features, and Benefits for Leave and Absence Management
Employee Self Service (ESS) gives employees access to manage their personal data, leave requests, or absences themselves without coordinating every step with HR. The term originally comes from SAP HR modules and has become an umbrella term for self-service features in human resources. Its benefits are particularly clear in leave and absence management.
Anna Keller
Content manager at absentify